转载自可口可乐不甜
问题现象
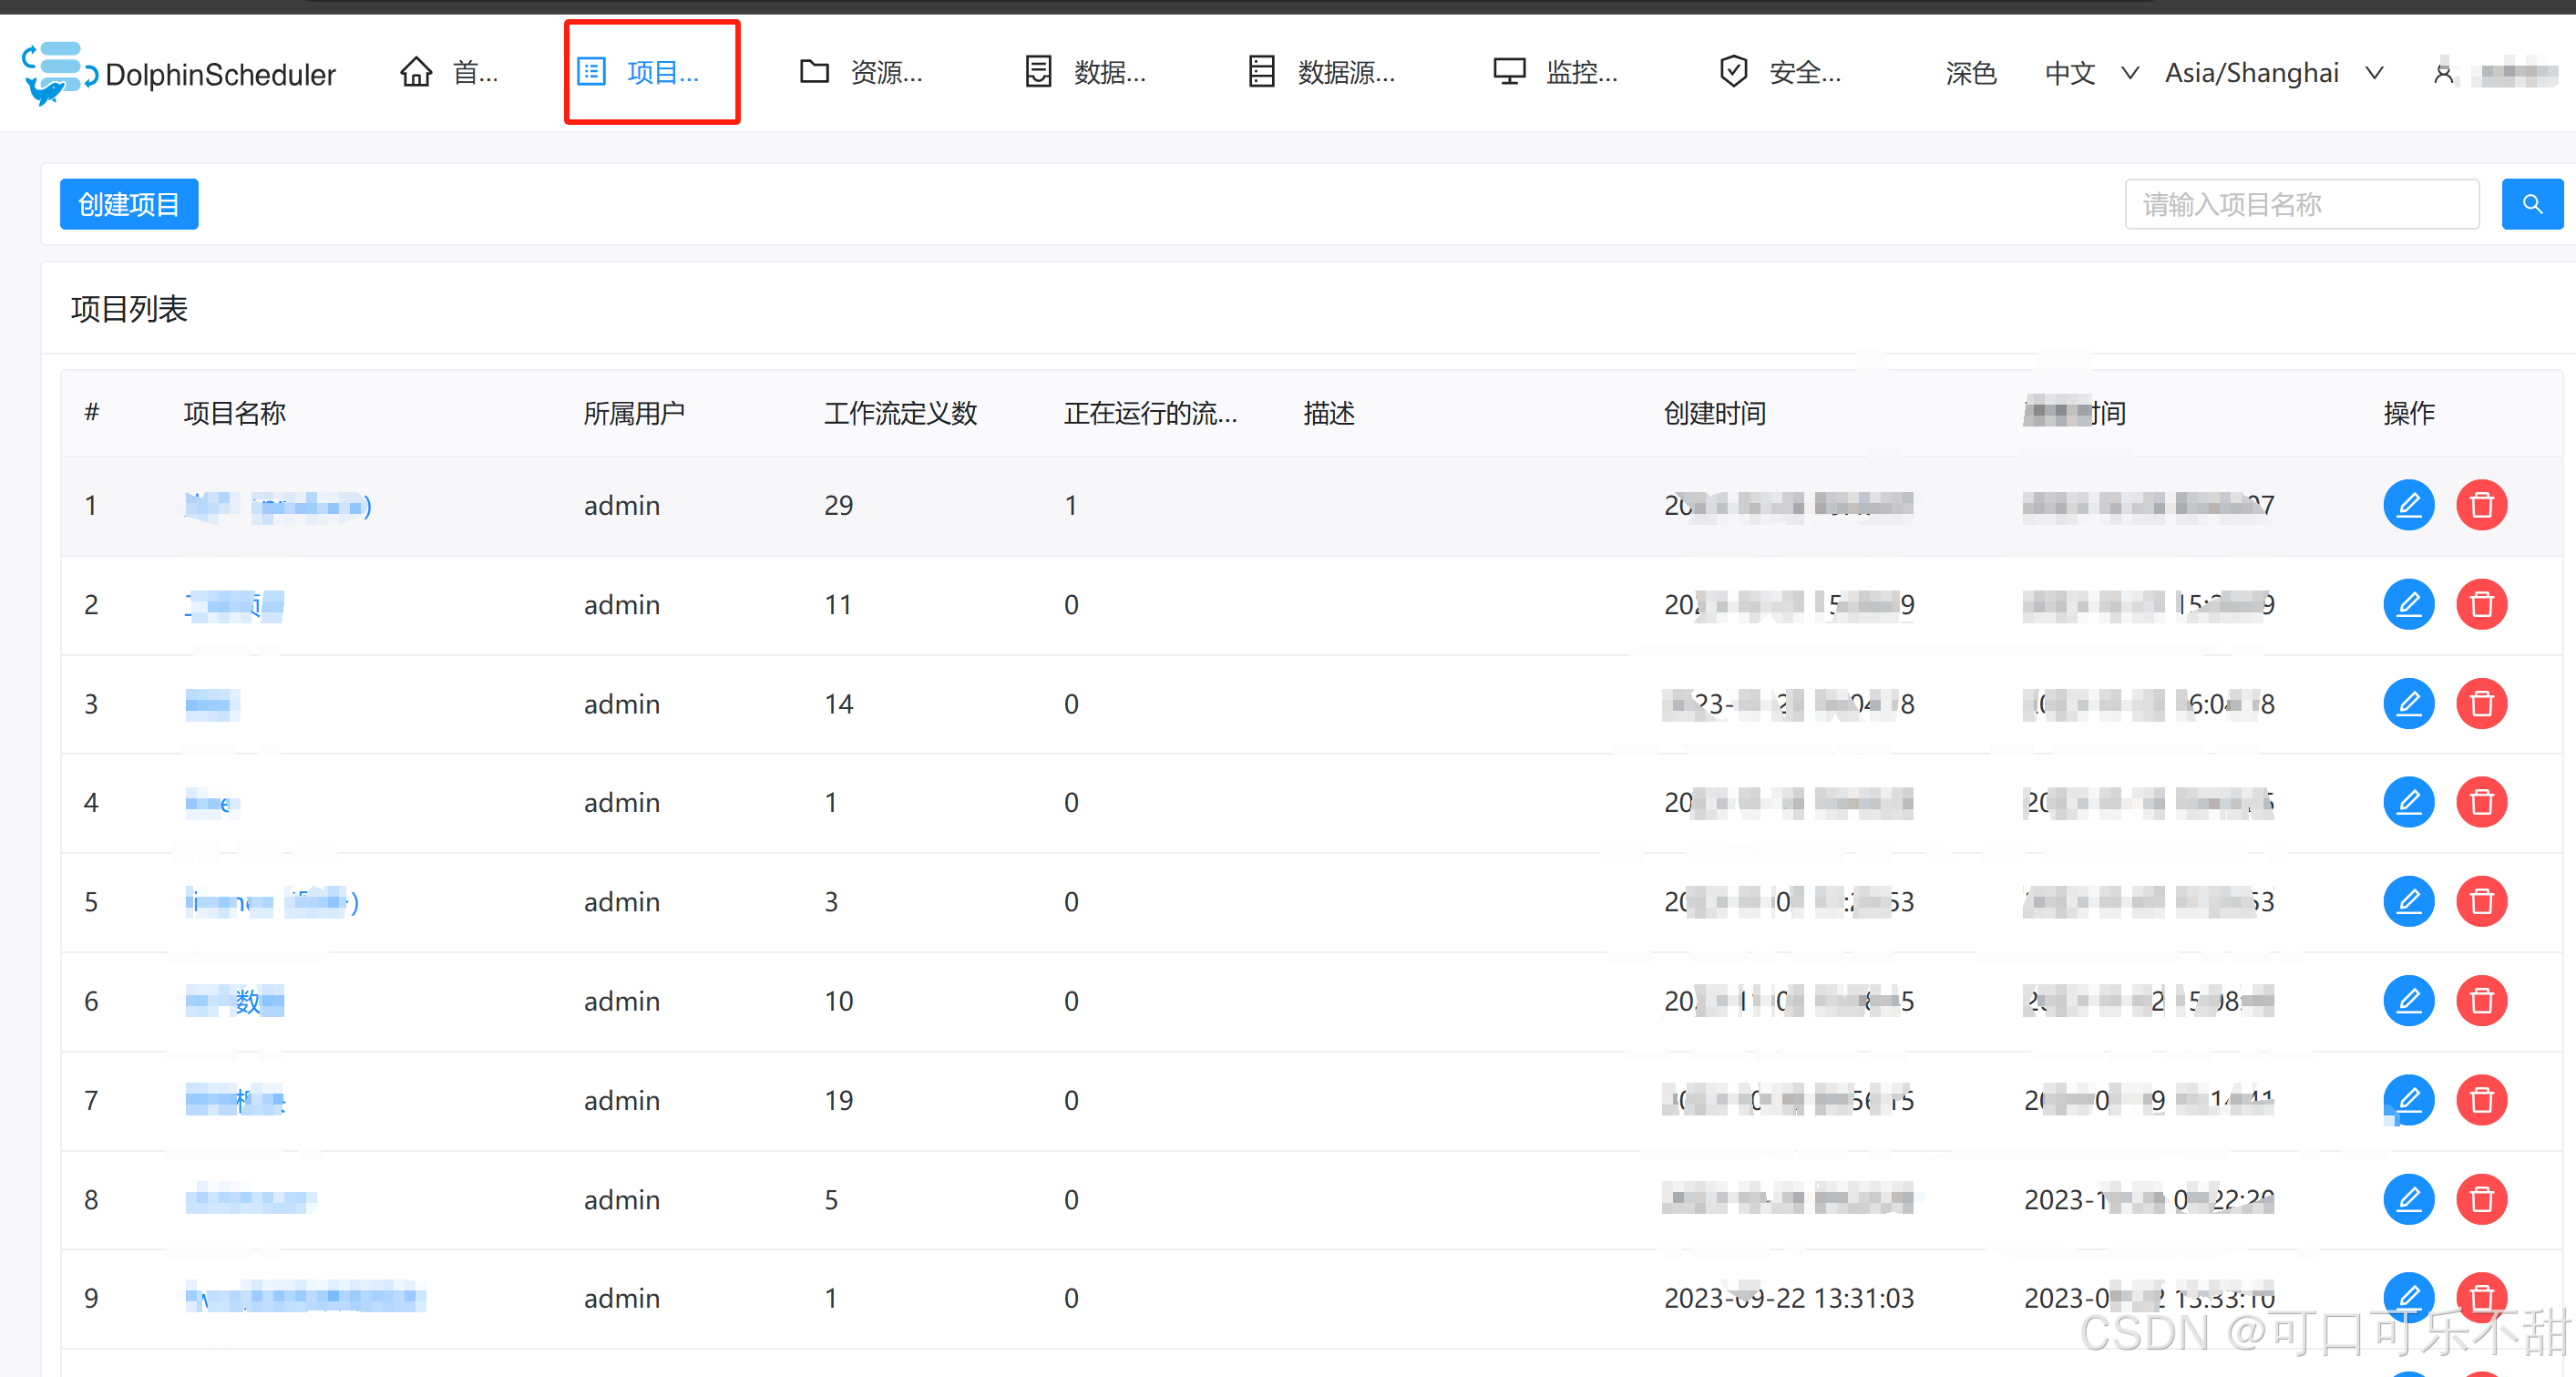
有时候,Apache 项目管理页面会发生加载不出来的问题,浏览器查看为[http://ip:12345/dolphinscheduler/projects?pageSize=10&pageNo=1&searchVal=]请求超时。
解决思路
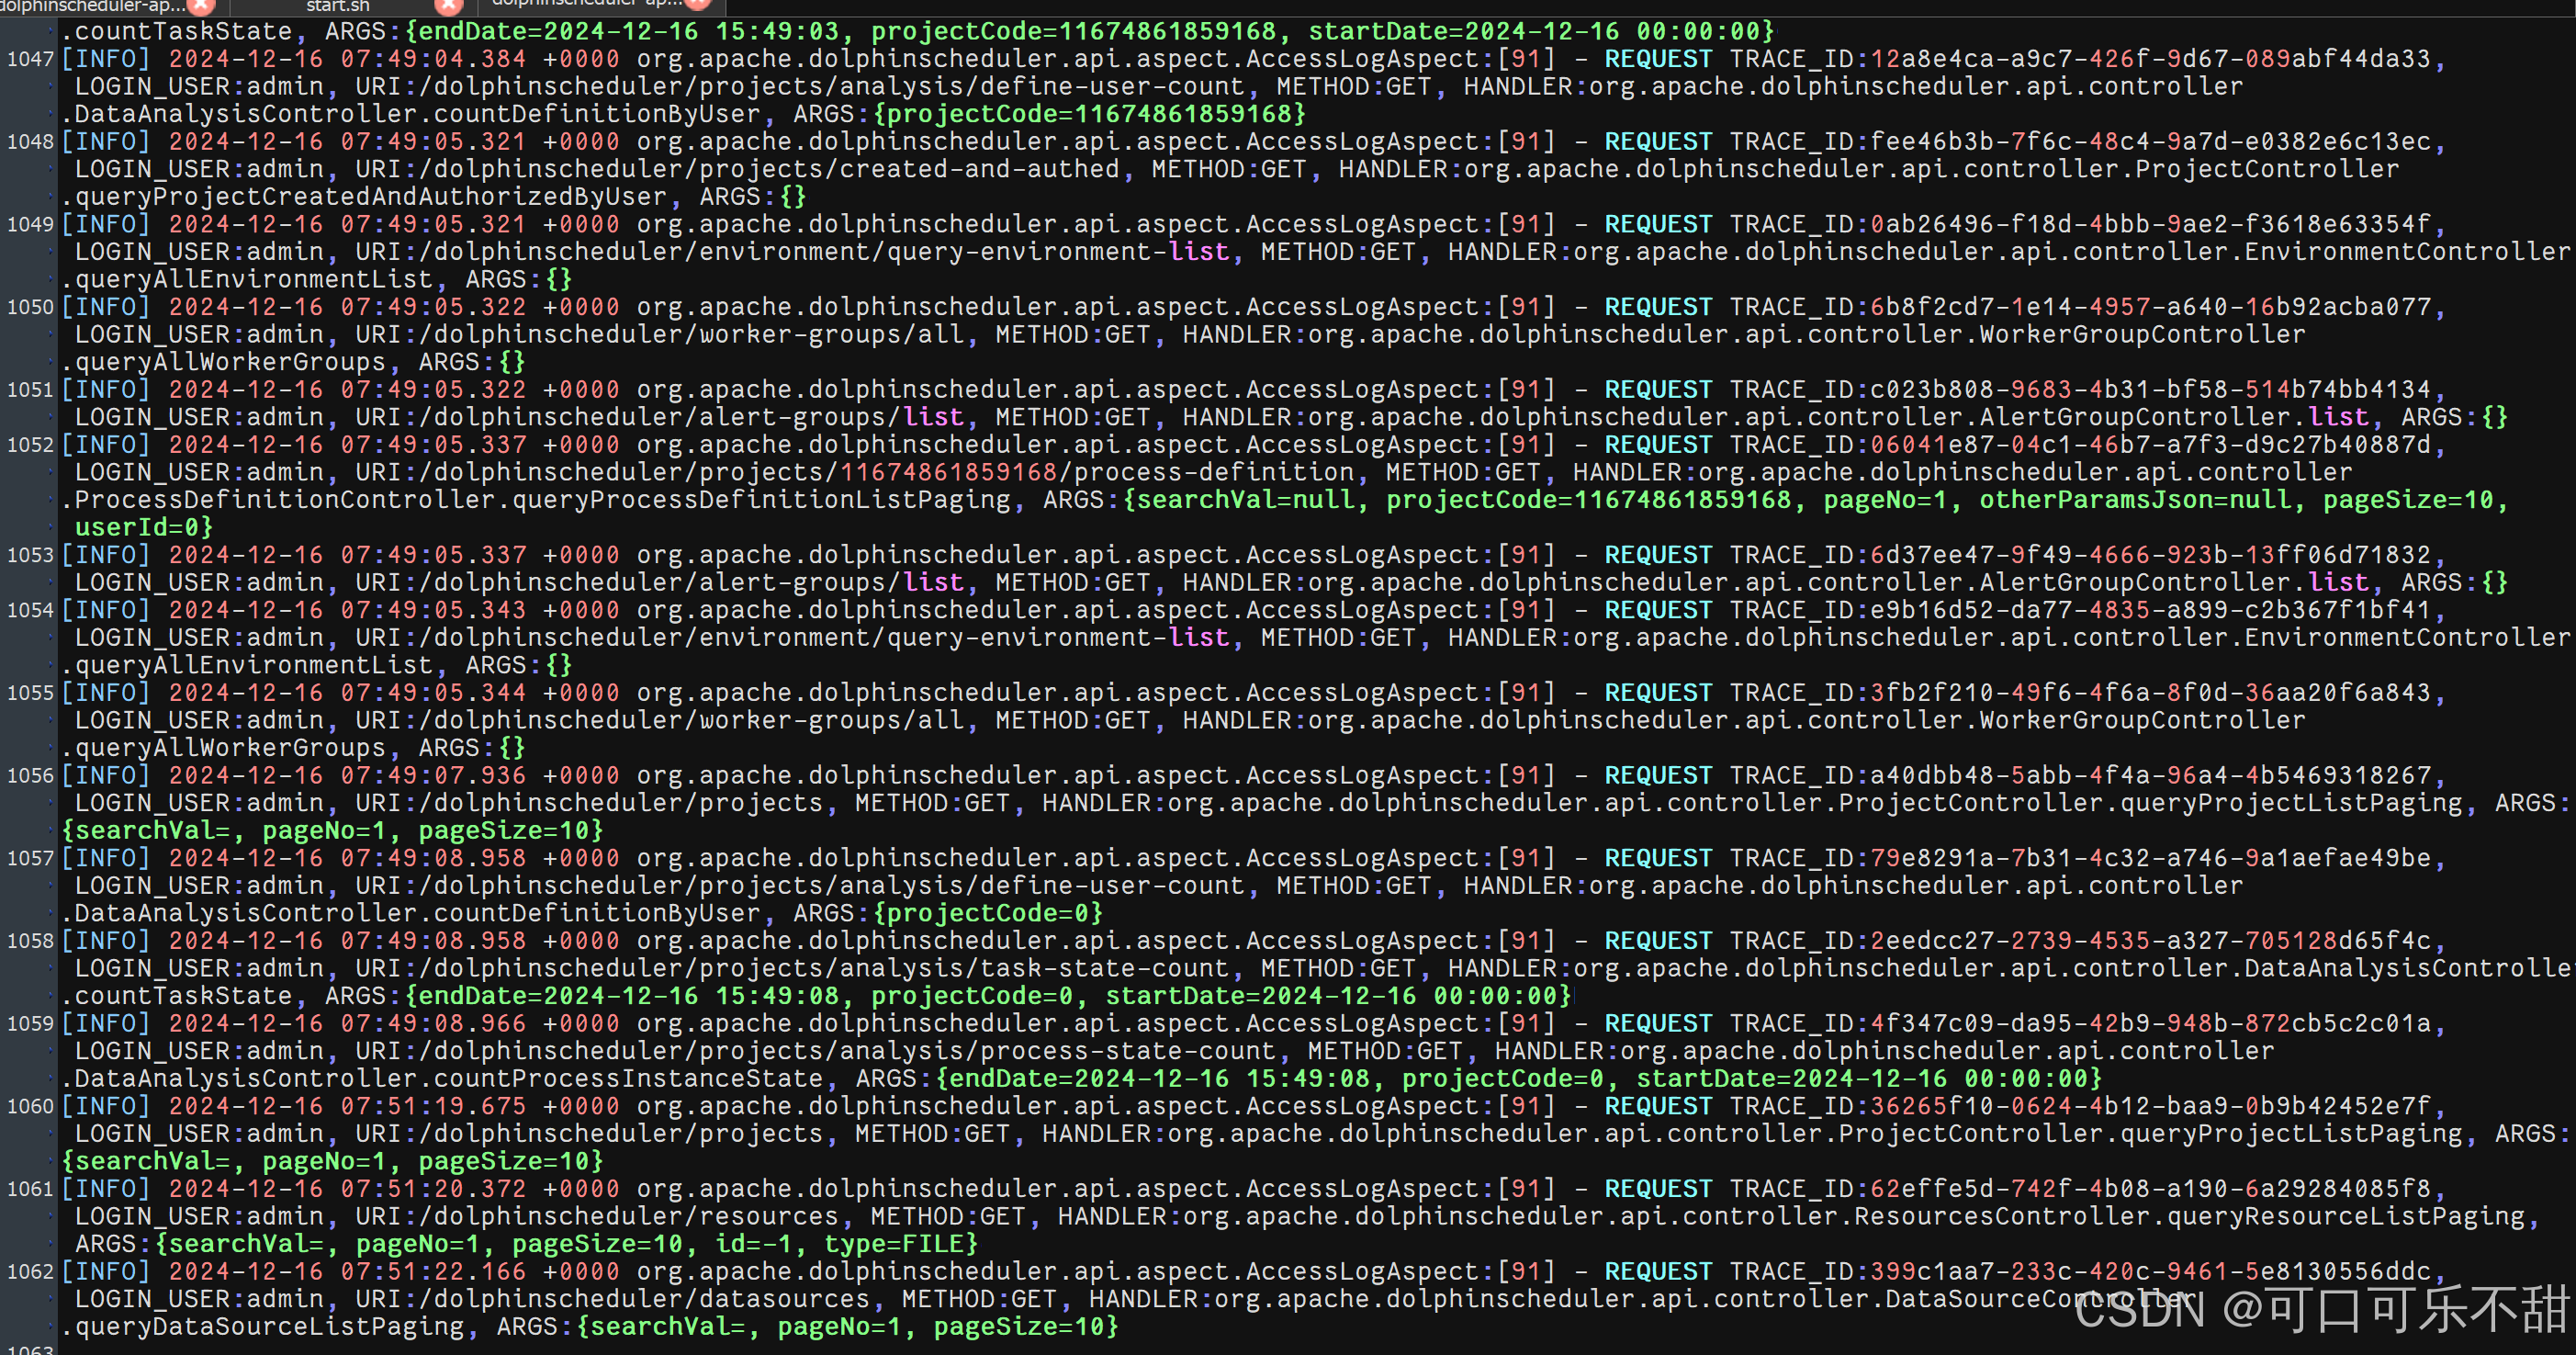
查看海豚运行日志(未发现异常)
tail /home/dolphinscheduler/api-server/logs/dolphinscheduler-api.log
尝试重启海豚的api-server模块
sh /home/dolphinscheduler/bin/dolphinscheduler-daemon.sh stop api-serversh /home/dolphinscheduler/bin/dolphinscheduler-daemon.sh start api-server
结果:还是加载不出来
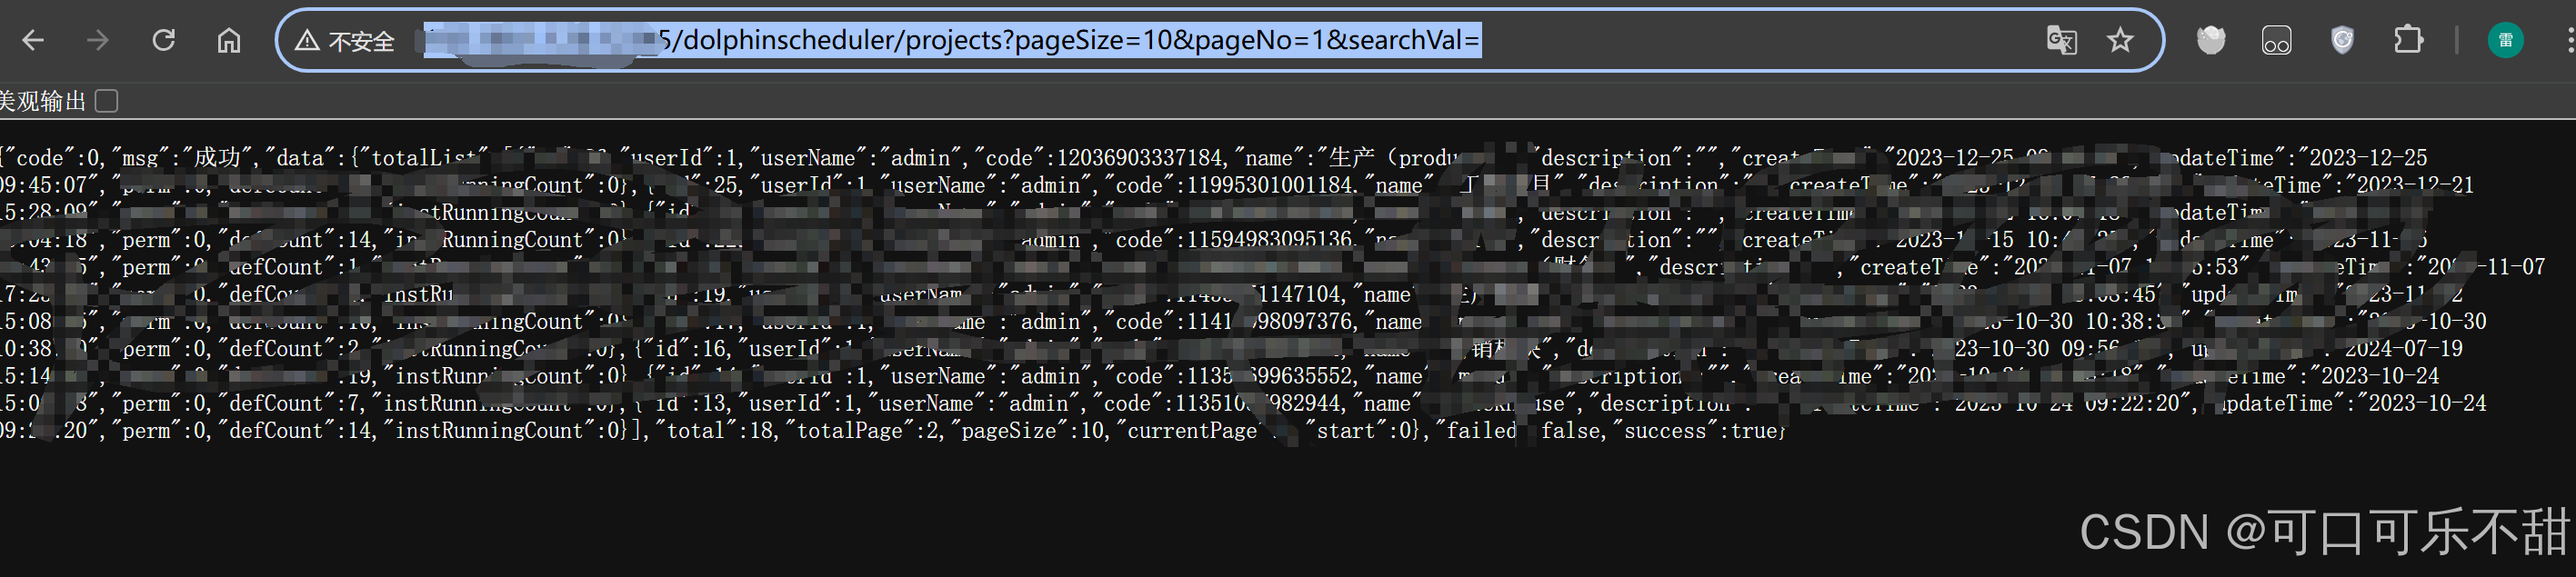
尝试请求超时连接发现请求能出数据,但是要十多秒
尝试查看源码,可能是慢查询
代码位置
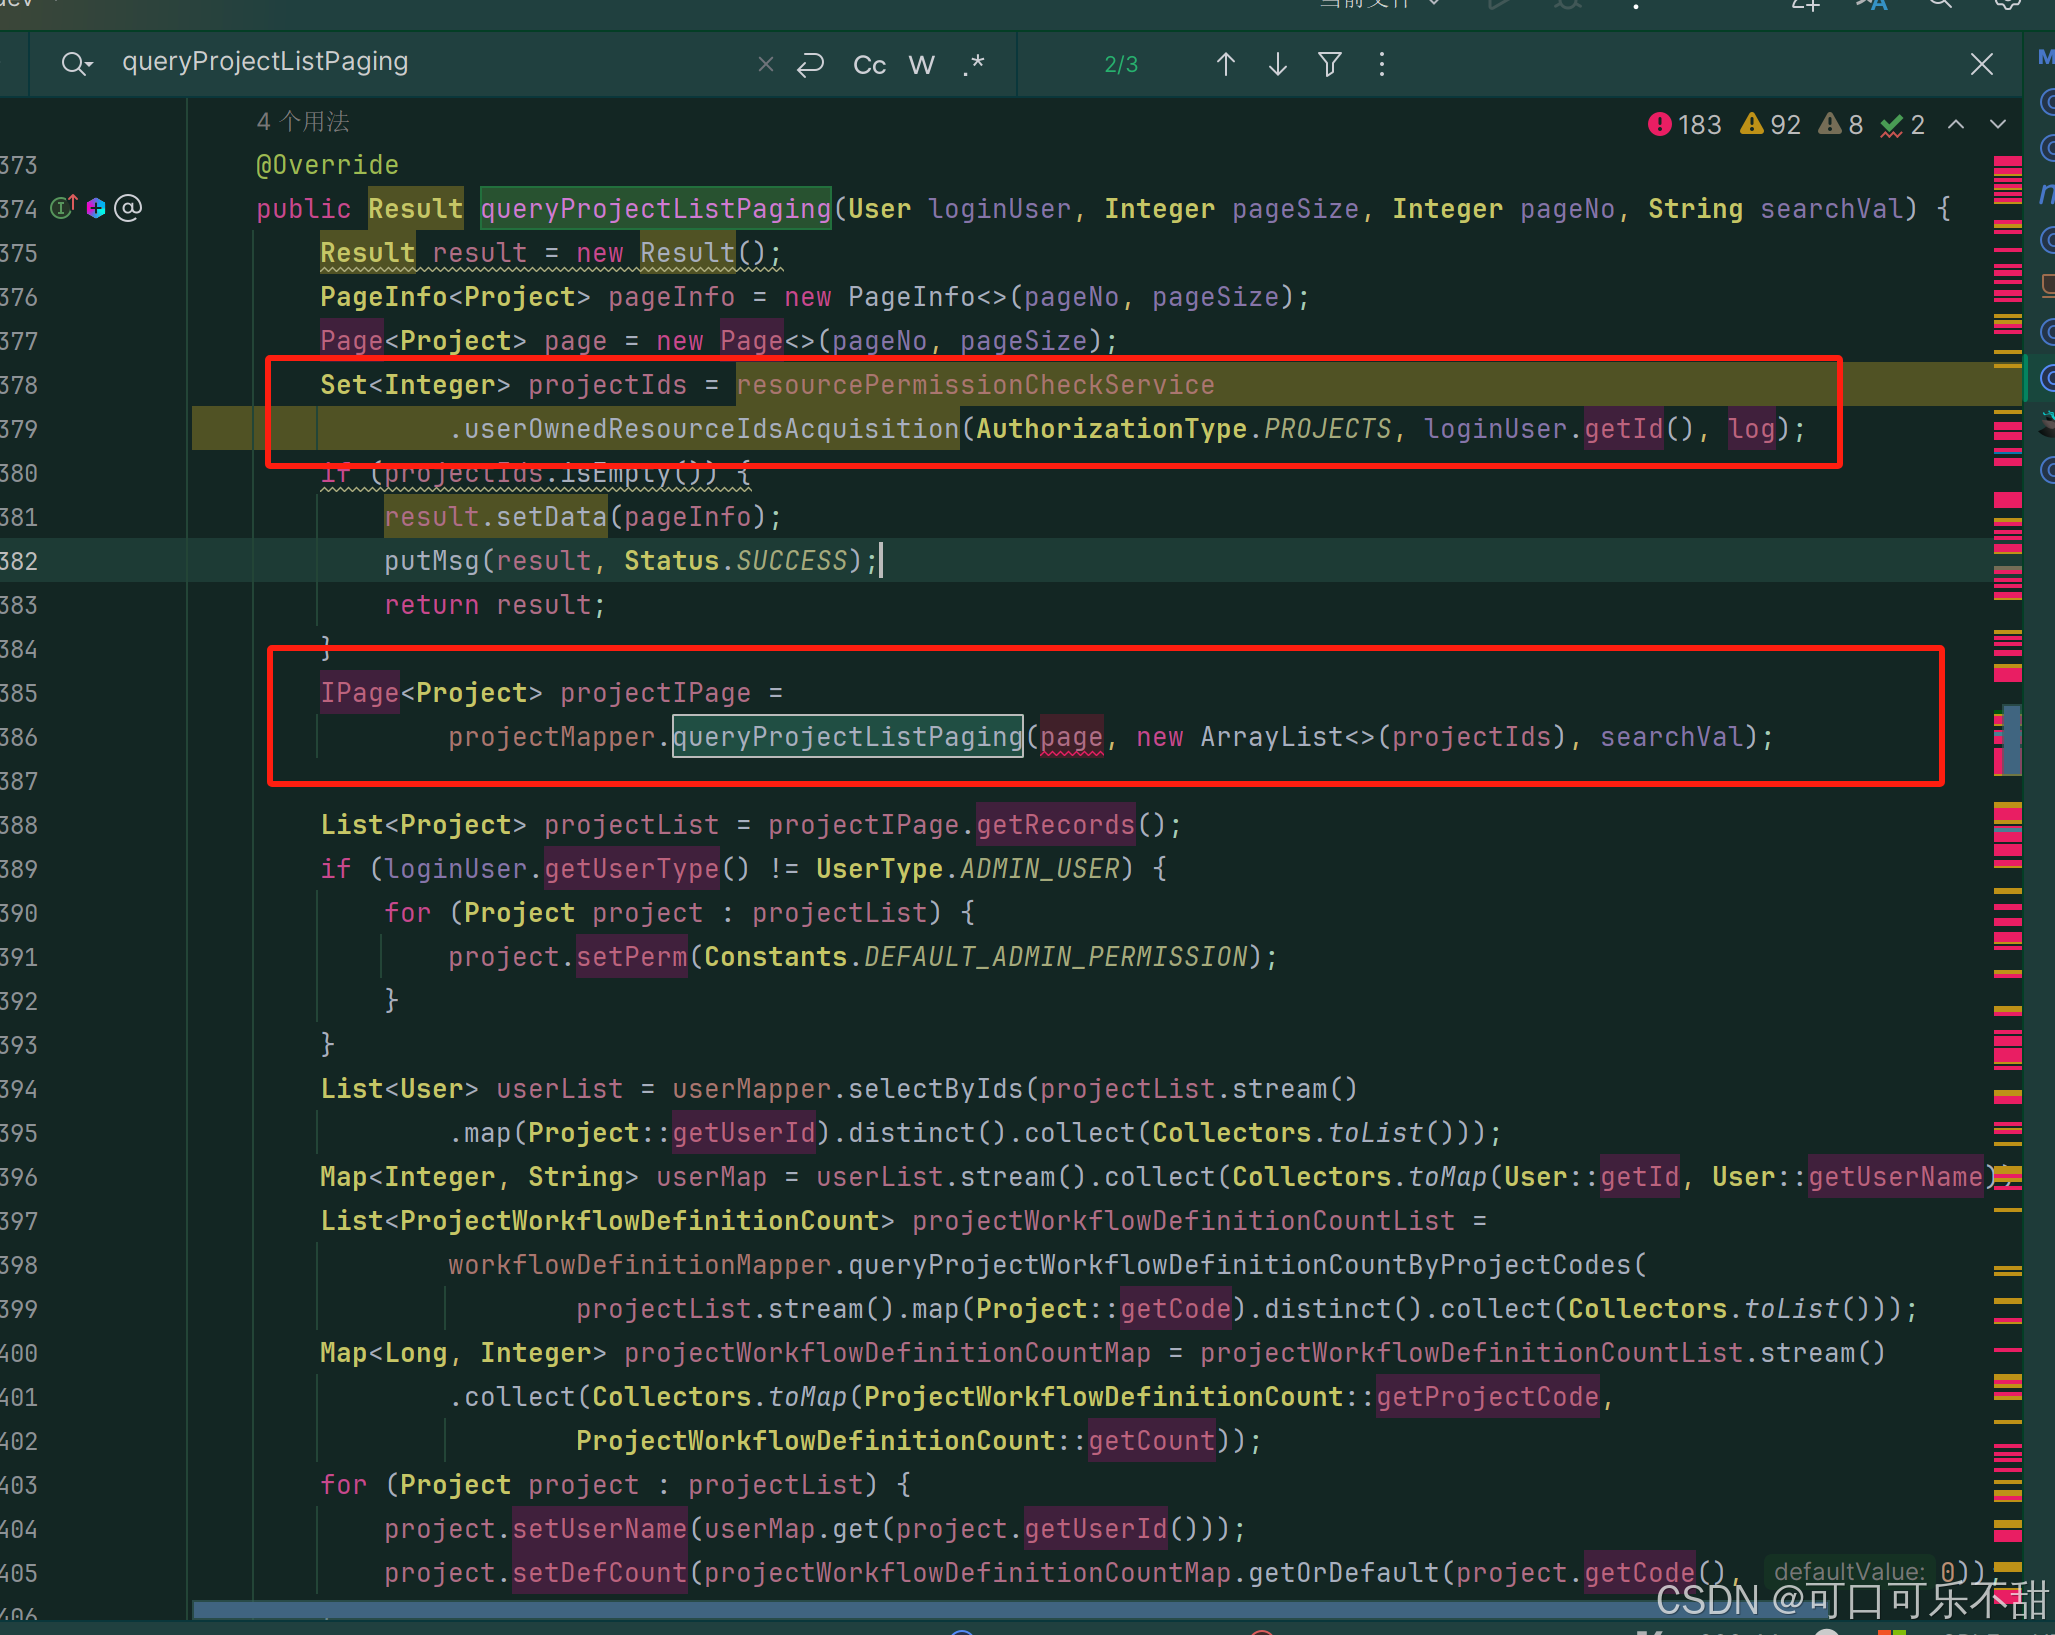
使用arthas查看运行情况
查看运行状况,查看是哪里运行时间长。可以看到是queryProjectListPaging方法。
trace org.apache.dolphinscheduler.api.service.impl.ProjectServiceImpl queryProjectListPaging -n 1
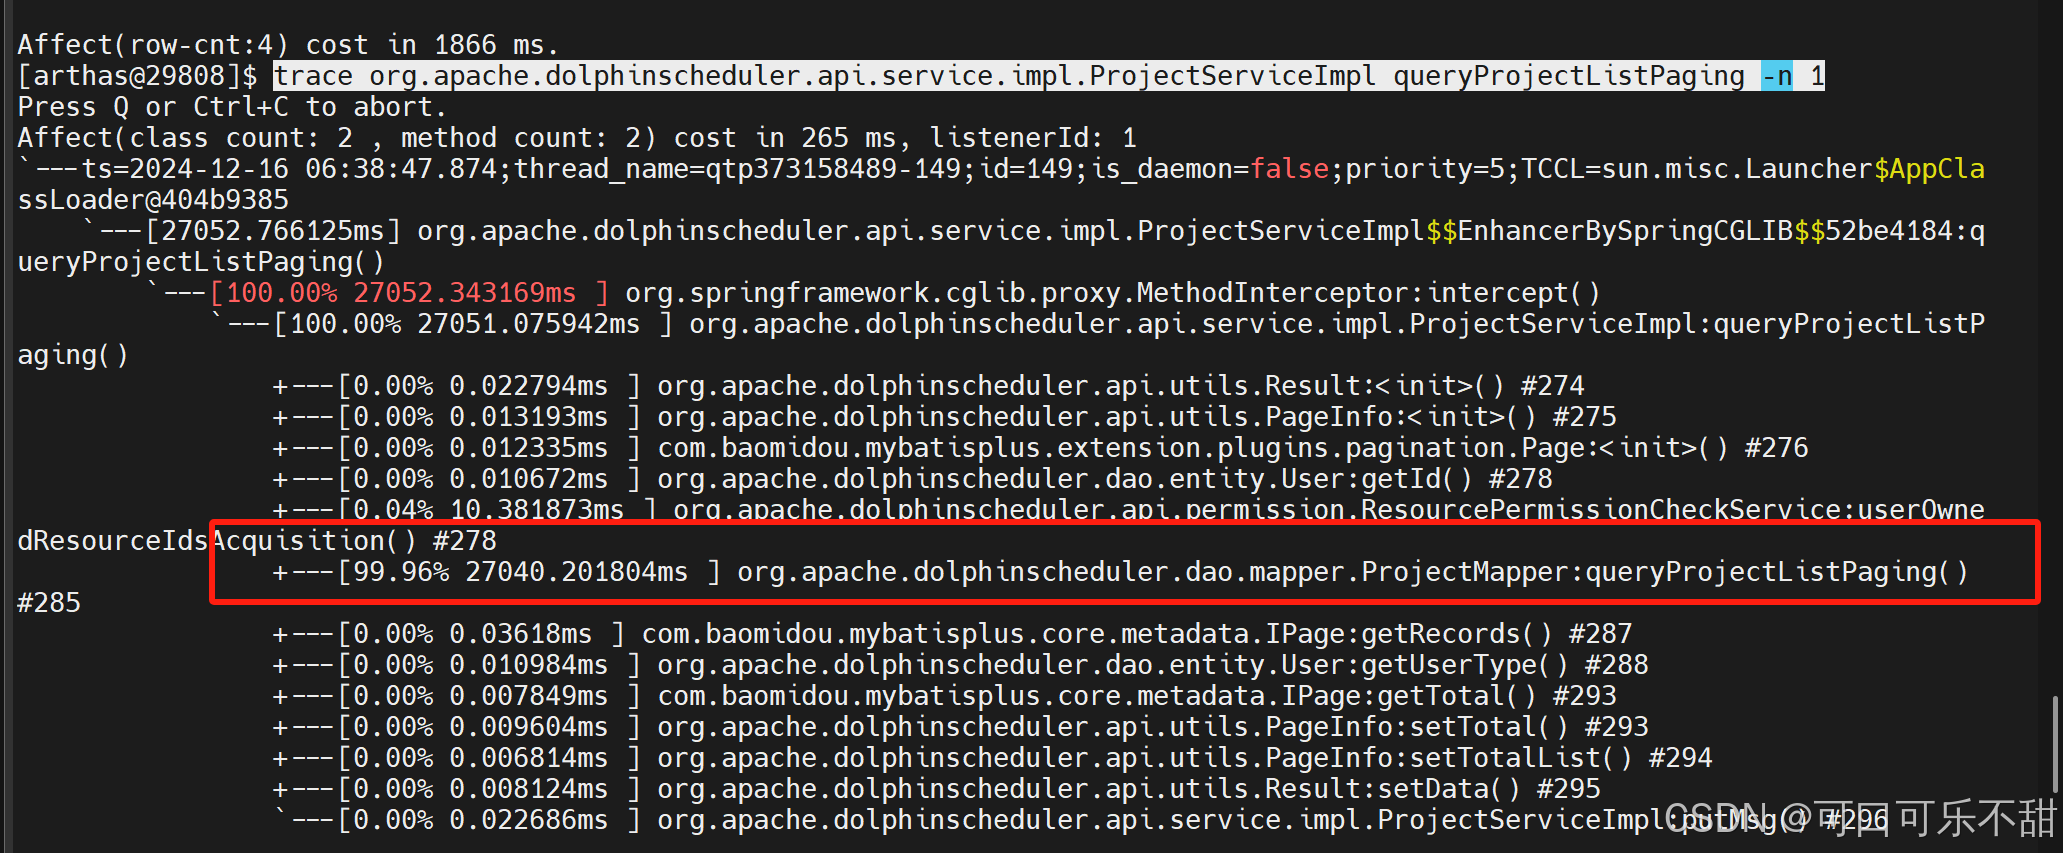
进入queryProjectListPaging方法

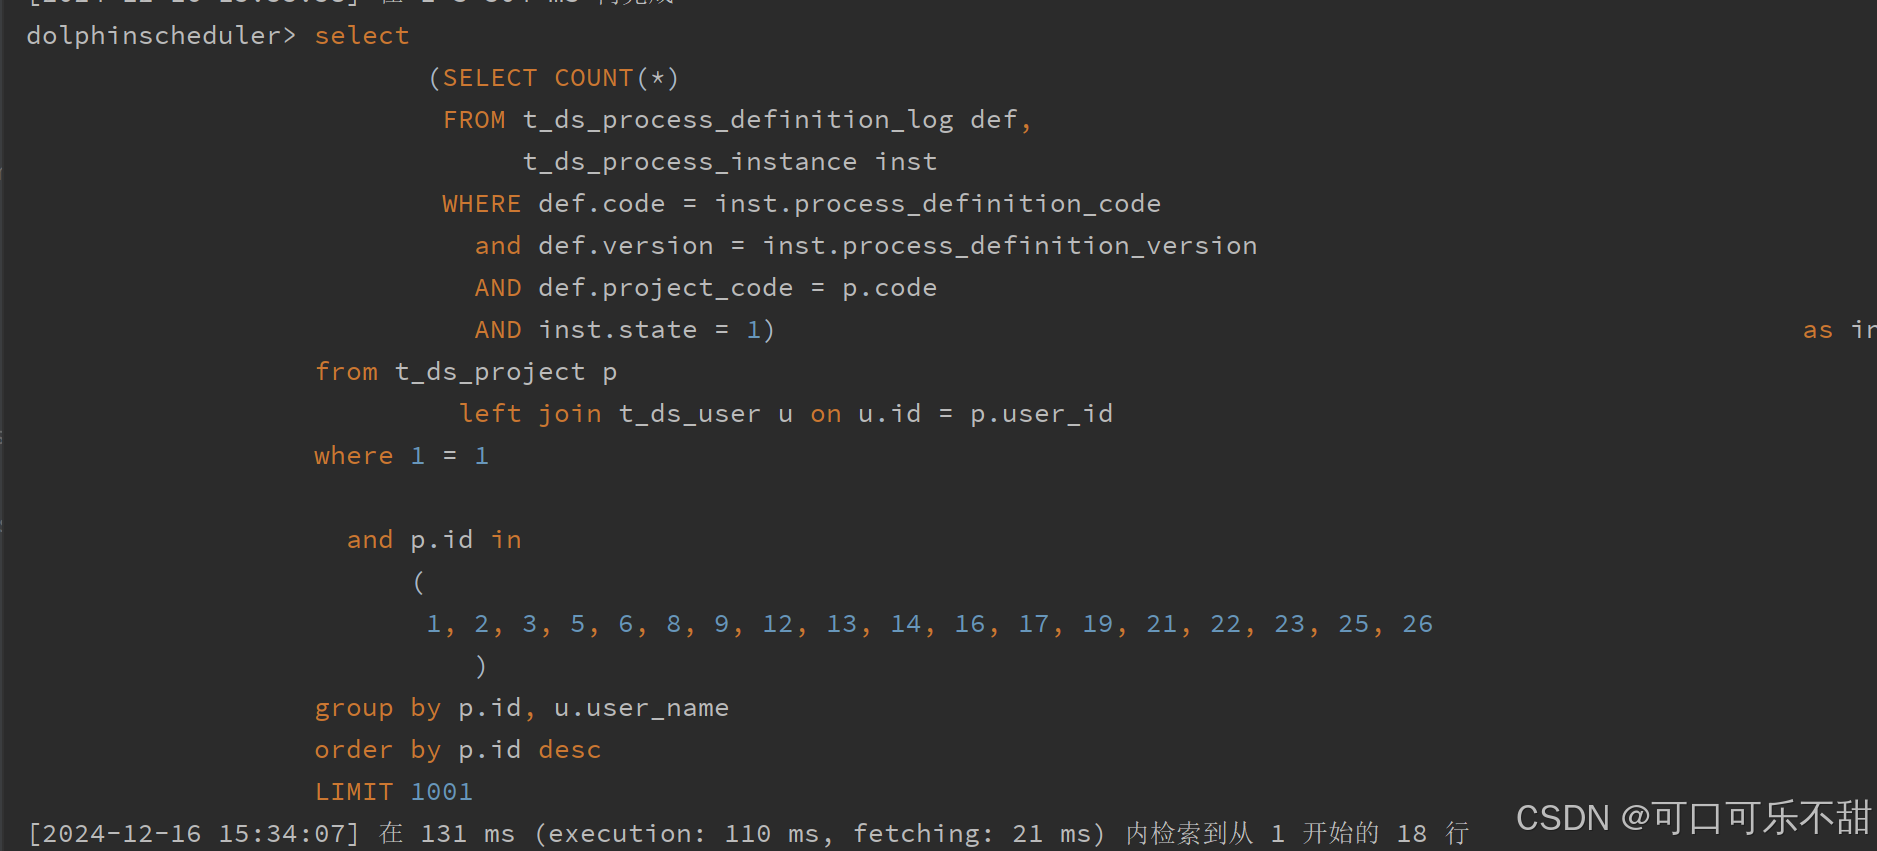
尝试运行sql,发现没有很慢。


尝试运行海运再运行中的sql,这里使用了arthas加上https://ctbots.com/#/arthas/parseMybatisSql辅助获取运行的sql。

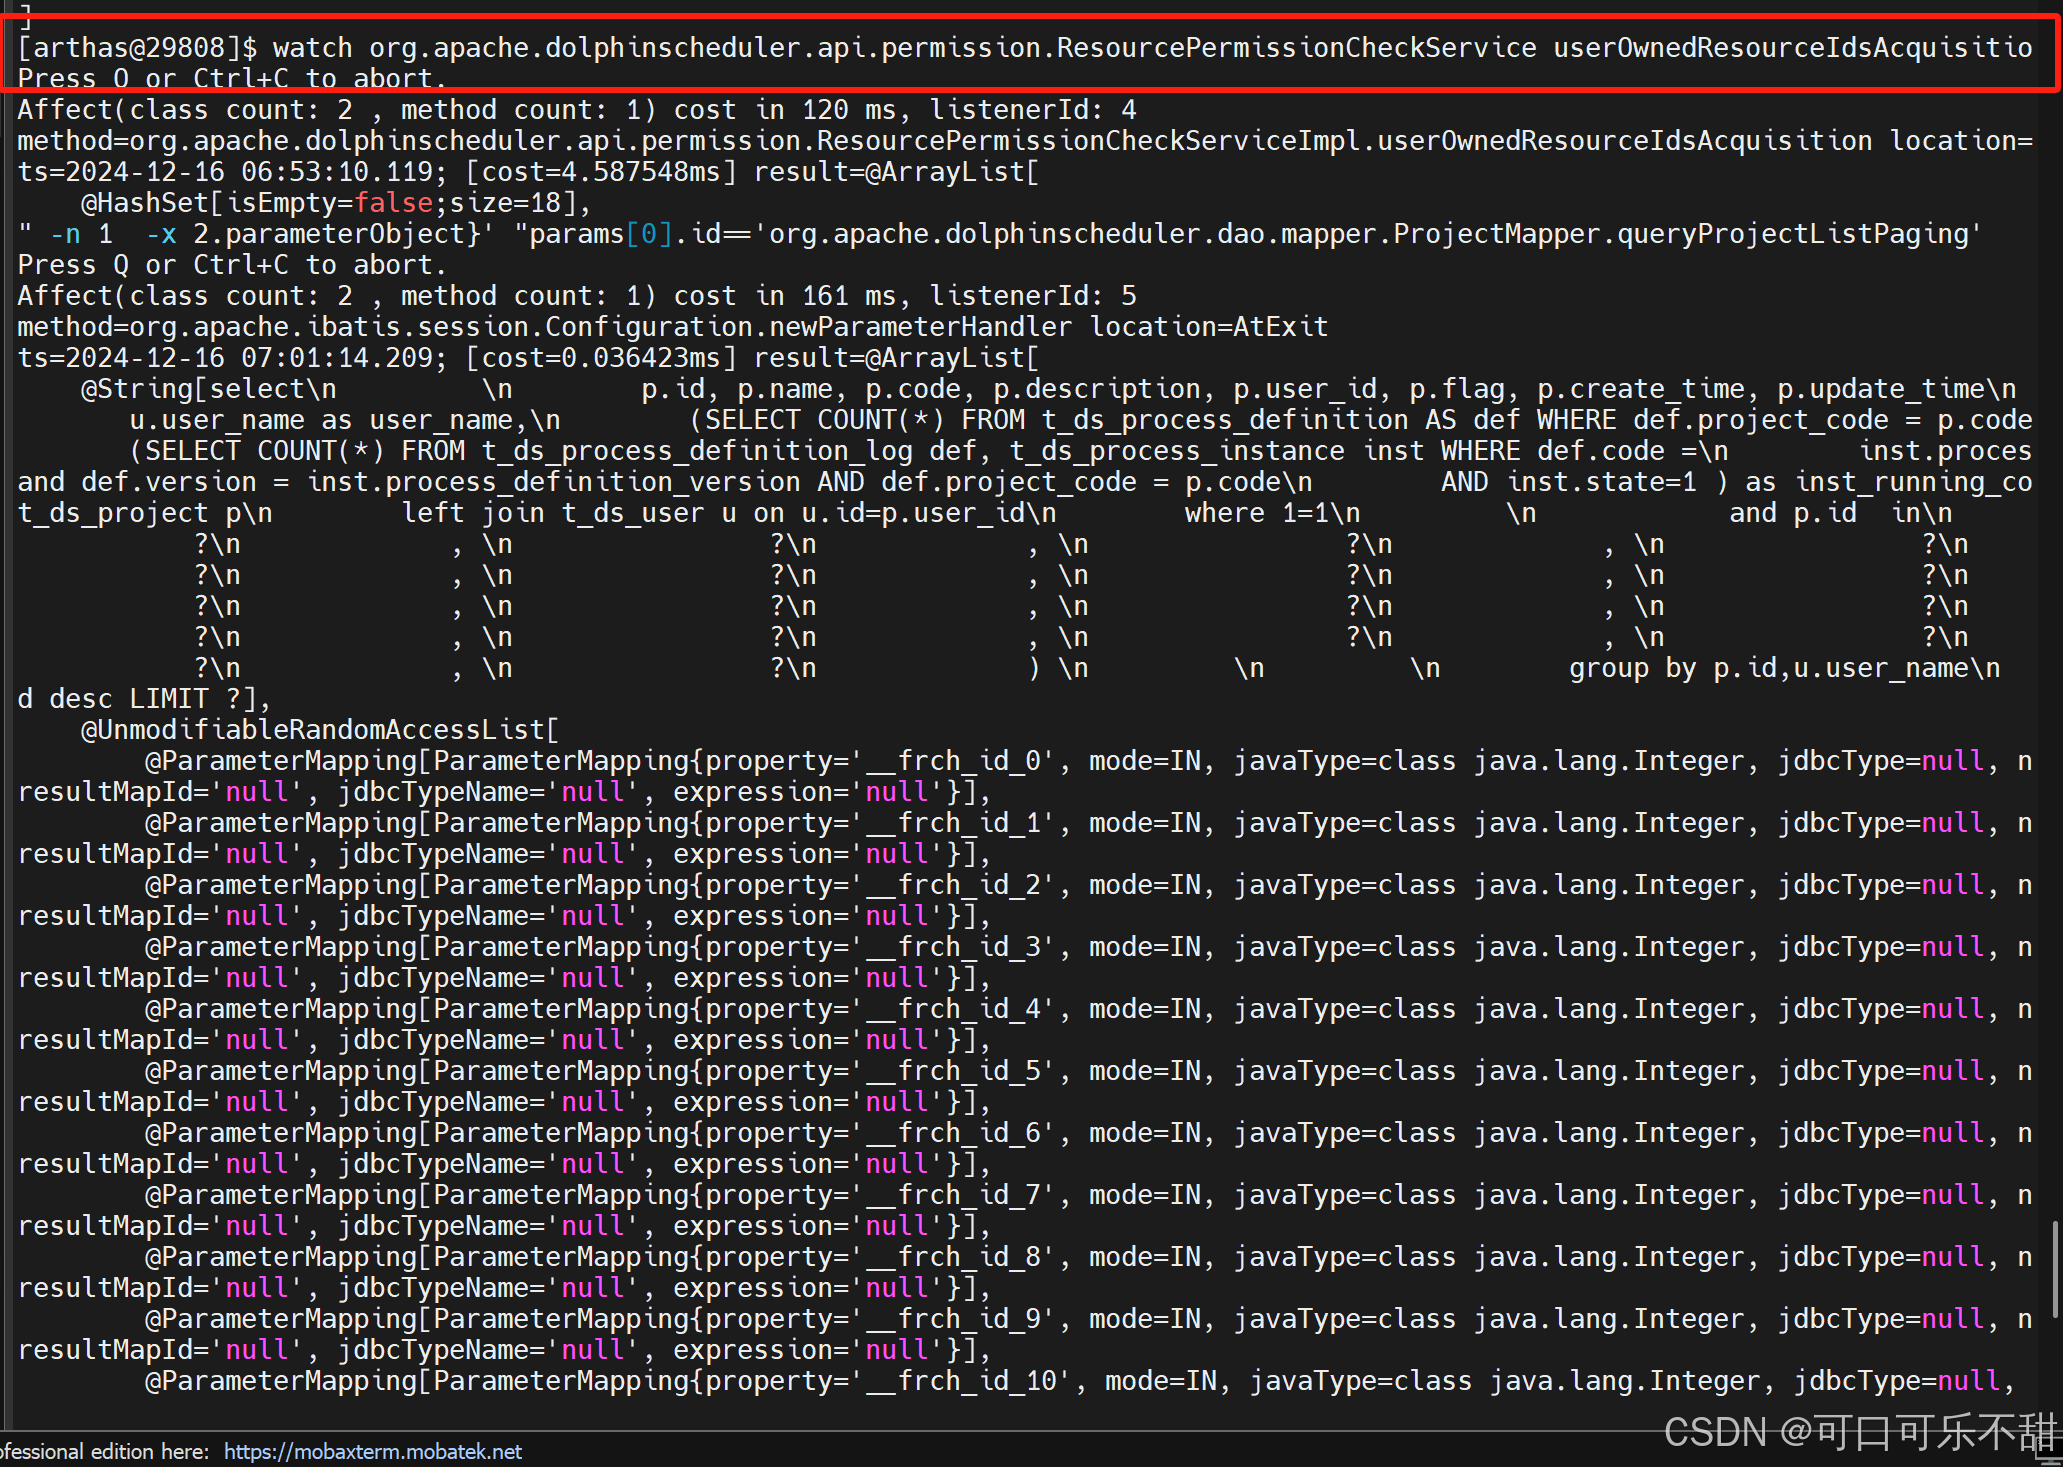
6. 获得慢sql,进行分析
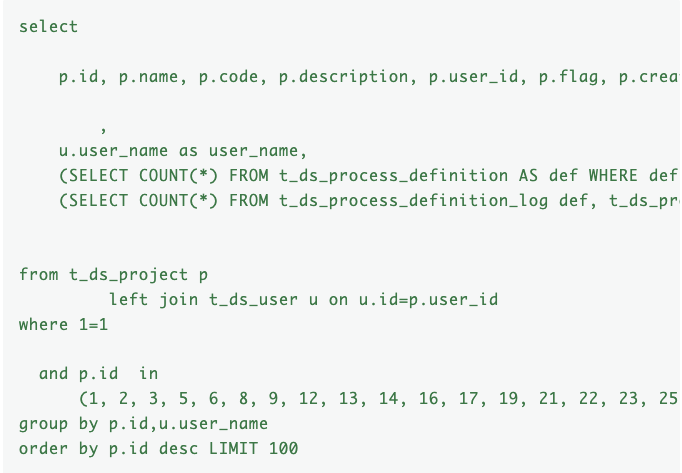
通过explain分析sql可知是inst_running_count这里查询慢。查看t_ds_process_definition表就28万多数据,t_ds_process_definition_log表有1千数据。
由此可知是日志数据太多了。尝试优化这个查询,给t_ds_process_instance加索引
```
create index qwl_diy_index
on t_ds_process_instance (process_definition_code, process_definition_version, state);
```
添加后验证,确实是快了。页面也恢复正常了。
原文链接:https://blog.csdn.net/weixin_41673092/article/details/144510764