https://github.com/apache/
点击蓝字 关注我们
前言
你有没有经历过这样的场景:DolphinScheduler 默默挂了半天,任务全部停摆,结果你还在工位上优哉游哉喝咖啡,直到老板冲过来问"数据怎么还没更新"——那一刻,你的表情大概和线上服务一样,卡住了。
在上篇文章 希望你永远用不上:Apache DolphinScheduler 任务阻塞死锁排查与解决方案中,我们聊过一个扎心的事实:DolphinScheduler 如果因为阻塞或死锁挂掉了,它自己是不会告警的——毕竟,一个"已经去世"的调度系统,你还指望它给你发遗言吗?
网上搜了一圈,关于 DolphinScheduler 对接 Prometheus 监控的完整实践方案,少得可怜。
所以本文来填这个坑:一份轻量、已在生产验证的 DolphinScheduler + Prometheus + Grafana 集成方案,从指标采集到告警规则到可视化看板,一条龙搞定。
一、整体方案概览
先看全局视角,整个监控链路其实就三步:
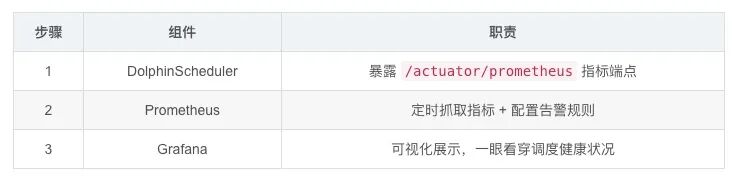
简单来说:DolphinScheduler 负责"把脉",Prometheus 负责"看诊",Grafana 负责"出报告"。三者配合,你就可以安心喝咖啡了(这次是真的安心)。
二、接入 Prometheus
DolphinScheduler 2.0.0 及以上版本内置了 Prometheus 指标端点,无需额外插件。
验证方式——直接 curl 一下:
curl http://<dolphin-host>:12345/dolphinscheduler/actuator/prometheus
如果返回了一堆 ds_ 开头的指标数据,恭喜你,DolphinScheduler 已经准备好被"监视"了。如果返回 404……那说明版本不够新,建议升级后再来。
在 prometheus.yml 中添加以下抓取配置:
scrape_configs: # 主机监控(可选,用于监控 Dolphin 所在服务器资源) - job_name: 'node-exporter' static_configs: - targets: - '<dolphin-host>:9100' labels: instance: 'dolphin-server' nodename: 'dolphin-server' # DolphinScheduler 指标采集 - job_name: 'dolphinscheduler' static_configs: - targets: ['<dolphin-host>:12345'] labels: service: dolphinscheduler metrics_path: '/dolphinscheduler/actuator/prometheus' metric_relabel_configs: - source_labels: [application] target_label: app - regex: 'application' action: labeldrop
Tips:
这才是整篇文章的灵魂——不配告警的监控,跟不监控有什么区别?
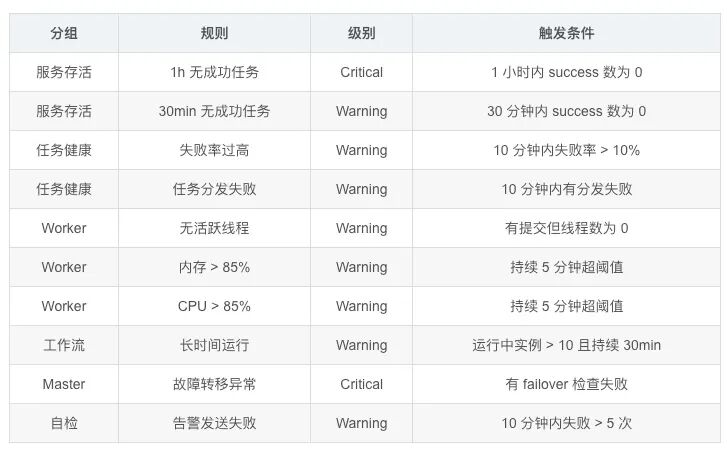
创建告警规则文件 dolphinscheduler-rules.yml,以下是经过生产验证的 10 条规则,覆盖了从"DolphinScheduler 挂了"到"任务跑飞了"的各种场景:
# DolphinScheduler 监控告警规则groups: - name: dolphinscheduler-alerts rules: # ============ 核心规则:服务存活检测 ============ # 规则1:一小时内没有成功的任务(大概率已经挂了) - alert: DolphinScheduler一小时无成功任务 expr: increase(ds_task_instance_count_total{state="success"}[1h]) == 0 for: 5m labels: severity: critical group: dolphinscheduler annotations: summary: "DolphinScheduler 一小时内无成功任务" description: "实例 {{ $labels.application }} 在过去 1 小时内没有产生成功的任务,可能已经挂掉,请立即检查服务状态" # 规则2:30分钟内没有成功的任务(预警) - alert: DolphinScheduler30分钟无成功任务 expr: increase(ds_task_instance_count_total{state="success"}[30m]) == 0 for: 5m labels: severity: warning group: dolphinscheduler annotations: summary: "DolphinScheduler 30分钟内无成功任务" description: "实例 {{ $labels.application }} 在过去 30 分钟内没有产生成功的任务,请注意检查" # ============ 任务健康度检测 ============ # 规则3:任务失败率过高 - alert: DolphinScheduler任务失败率高 expr: | ( increase(ds_task_instance_count_total{state="fail"}[10m]) / (increase(ds_task_instance_count_total{state="finish"}[10m]) + 1) ) > 0.1 for: 5m labels: severity: warning group: dolphinscheduler annotations: summary: "DolphinScheduler 任务失败率过高" description: "实例 {{ $labels.application }} 在过去 10 分钟内任务失败率超过 10%,当前失败率: {{ $value | humanizePercentage }}" # 规则4:任务分发失败 - alert: DolphinScheduler任务分发失败 expr: increase(ds_task_dispatch_failure_count_total[10m]) > 0 labels: severity: warning group: dolphinscheduler annotations: summary: "DolphinScheduler 任务分发失败" description: "实例 {{ $labels.application }} 在过去 10 分钟内有 {{ $value }} 次任务分发失败" # ============ Worker 健康检测 ============ # 规则5:Worker 活跃线程数为 0(有任务提交却没人干活) - alert: DolphinScheduler Worker无活跃线程 expr: ds_worker_active_execute_thread == 0 and increase(ds_task_instance_count_total{state="submit"}[5m]) > 0 for: 10m labels: severity: warning group: dolphinscheduler annotations: summary: "DolphinScheduler Worker 无活跃执行线程" description: "实例 {{ $labels.application }} 的 Worker 没有活跃的执行线程,但有任务提交,任务可能无法执行" # 规则6:Worker 内存使用率过高 - alert: DolphinScheduler Worker内存使用率高 expr: ds_worker_memory_usage > 0.85 for: 5m labels: severity: warning group: dolphinscheduler annotations: summary: "DolphinScheduler Worker 内存使用率过高" description: "实例 {{ $labels.application }} 的 Worker 内存使用率为 {{ $value | humanizePercentage }},超过 85%" # 规则7:Worker CPU 使用率过高 - alert: DolphinScheduler Worker CPU使用率高 expr: ds_worker_cpu_usage > 0.85 for: 5m labels: severity: warning group: dolphinscheduler annotations: summary: "DolphinScheduler Worker CPU 使用率过高" description: "实例 {{ $labels.application }} 的 Worker CPU 使用率为 {{ $value | humanizePercentage }},超过 85%" # ============ 工作流 & Master 检测 ============ # 规则8:工作流实例长时间运行(可能阻塞了) - alert: DolphinScheduler工作流长时间运行 expr: ds_workflow_instance_running > 10 for: 30m labels: severity: warning group: dolphinscheduler annotations: summary: "DolphinScheduler 工作流长时间运行" description: "实例 {{ $labels.application }} 有 {{ $value }} 个工作流实例运行超过 30 分钟,可能存在阻塞" # 规则9:Master 故障转移检查异常 - alert: DolphinScheduler Master故障转移检查异常 expr: increase(ds_master_scheduler_failover_check_count_total{result="fail"}[10m]) > 0 labels: severity: critical group: dolphinscheduler annotations: summary: "DolphinScheduler Master 故障转移检查异常" description: "实例 {{ $labels.application }} 在过去 10 分钟内 Master 故障转移检查失败 {{ $value }} 次" # ============ 告警通道自检 ============ # 规则10:告警发送失败(监控系统的监控,套娃了属于是) - alert: DolphinScheduler告警发送失败 expr: increase(ds_alert_send_count_total{status="fail"}[10m]) > 5 labels: severity: warning group: dolphinscheduler annotations: summary: "DolphinScheduler 告警发送失败" description: "实例 {{ $labels.application }} 在过去 10 分钟内有 {{ $value }} 次告警发送失败"这 10 条规则按场景分成了四组,用一张表总结一下:
当 DolphinScheduler 停止运行或任务因为某些原因暂停时,告警就会自动触发:
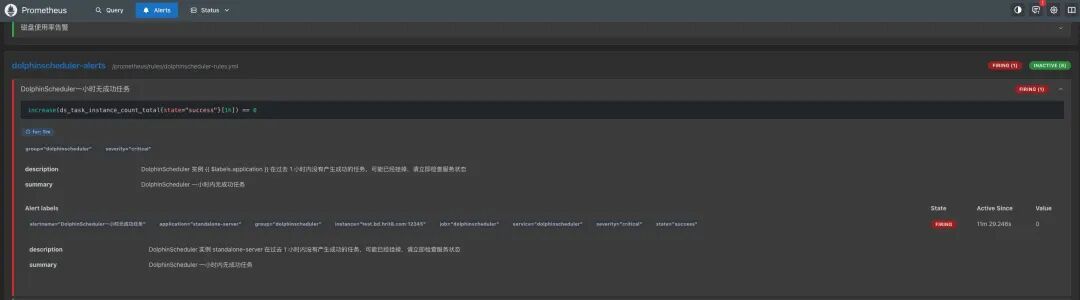
终于可以在服务挂掉的时候第一时间收到通知了,而不是等老板来通知你。
三、接入Grafana可视化看板
光 有告警还不够,我们还需要一个看板来直观了解调度系统的整体状态。Grafana 正好擅长干这事。
前提:Grafana 的数据源已经对接好了 Prometheus。如果还没配,先去 Grafana → Configuration → Data Sources 添加 Prometheus 数据源。
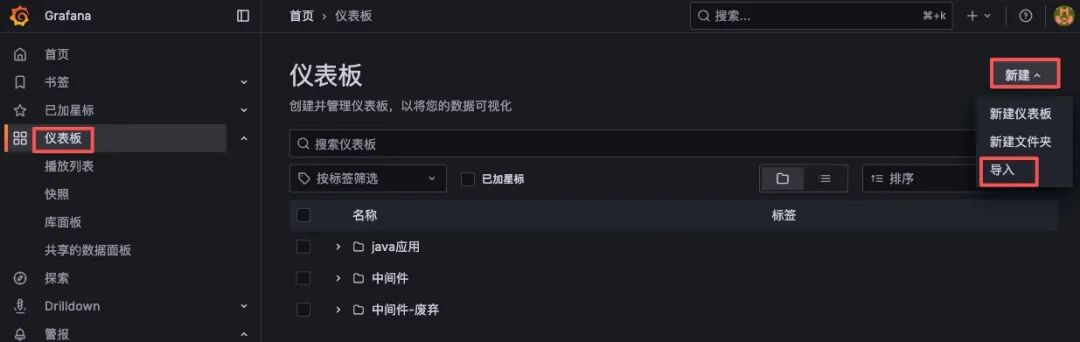
进入 Grafana → 仪表板 → 新建 → 导入
24841,然后点击 Load: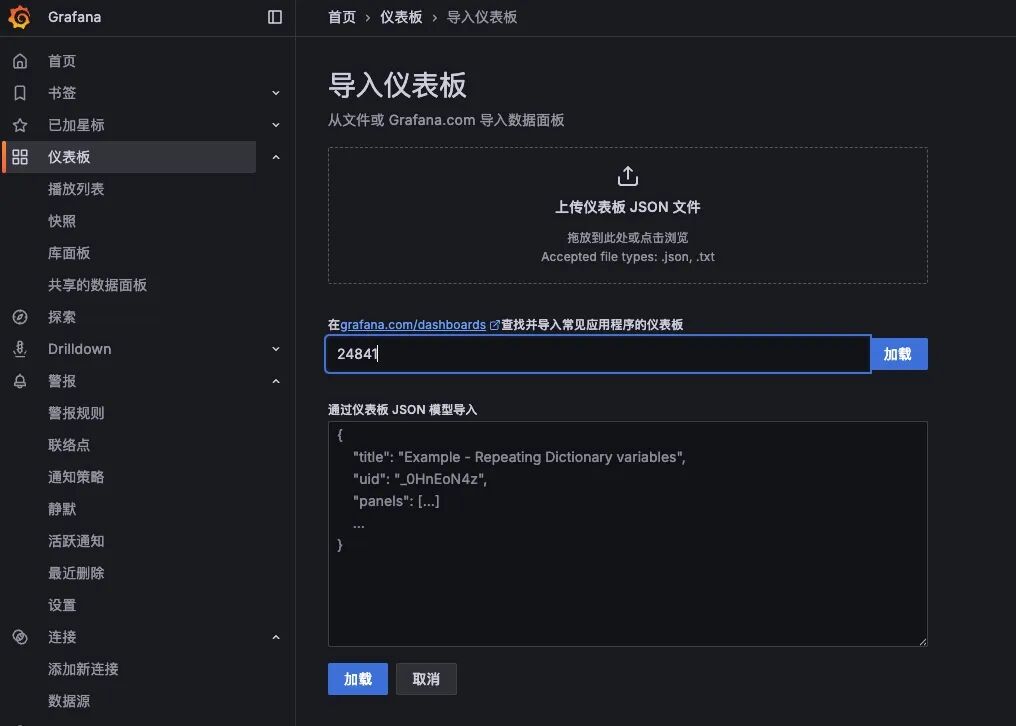
这是最简单的方式,一个数字搞定,比手动配 JSON 省心 100 倍。
如果你的 Grafana 无法访问外网 (公司内网环境懂的都懂),可以用以下 JSON 模板手动导入。
由于 JSON 较长,这里提供压缩版,直接复制到 Grafana 的 JSON 导入框即可:
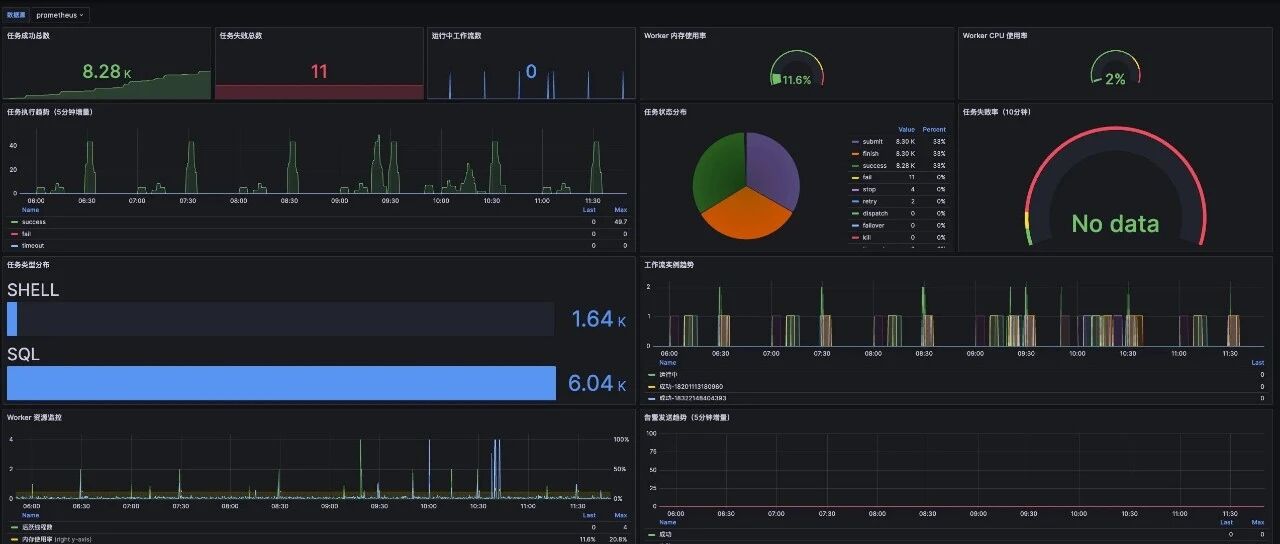
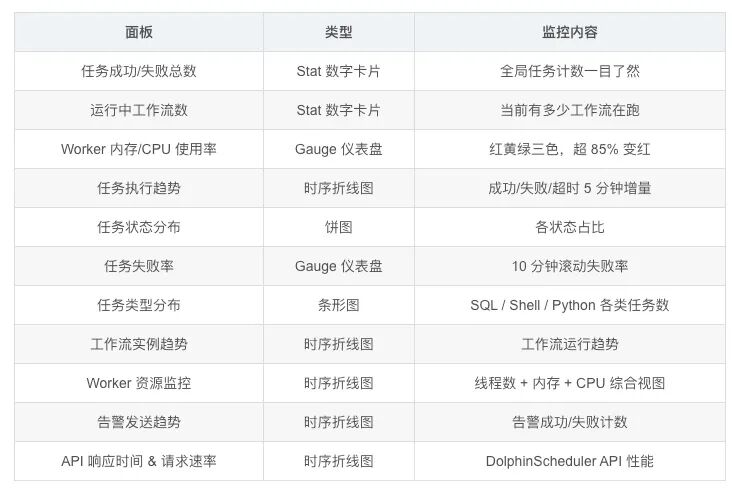
{"__inputs":[{"name":"DS_PROMETHEUS","label":"Prometheus","description":"","type":"datasource","pluginId":"prometheus","pluginName":"Prometheus"}],"__requires":[{"type":"grafana","id":"grafana","name":"Grafana","version":"9.0.0"},{"type":"datasource","id":"prometheus","name":"Prometheus","version":"1.0.0"},{"type":"panel","id":"stat","name":"Stat","version":""},{"type":"panel","id":"gauge","name":"Gauge","version":""},{"type":"panel","id":"timeseries","name":"Time series","version":""},{"type":"panel","id":"piechart","name":"Pie chart","version":""},{"type":"panel","id":"bargauge","name":"Bar gauge","version":""}],"annotations":{"list":[{"builtIn":1,"datasource":{"type":"datasource","uid":"grafana"},"enable":true,"hide":true,"iconColor":"rgba(0, 211, 255, 1)","name":"Annotations & Alerts","type":"dashboard"}]},"editable":true,"fiscalYearStartMonth":0,"graphTooltip":0,"id":null,"links":[],"liveNow":false,"panels":[{"datasource":{"type":"prometheus","uid":"${datasource}"},"fieldConfig":{"defaults":{"color":{"mode":"thresholds"},"mappings":[],"thresholds":{"mode":"absolute","steps":[{"color":"green","value":null}]},"unit":"short"},"overrides":[]},"gridPos":{"h":4,"w":4,"x":0,"y":0},"id":1,"options":{"colorMode":"value","graphMode":"area","justifyMode":"auto","orientation":"auto","reduceOptions":{"values":false,"calcs":["lastNotNull"],"fields":""},"textMode":"auto"},"pluginVersion":"9.5.0","targets":[{"datasource":{"type":"prometheus","uid":"${datasource}"},"expr":"ds_task_instance_count_total{state=\"success\"}","refId":"A"}],"title":"任务成功总数","type":"stat"},{"datasource":{"type":"prometheus","uid":"${datasource}"},"fieldConfig":{"defaults":{"color":{"mode":"thresholds"},"mappings":[],"thresholds":{"mode":"absolute","steps":[{"color":"green","value":null},{"color":"red","value":1}]},"unit":"short"},"overrides":[]},"gridPos":{"h":4,"w":4,"x":4,"y":0},"id":2,"options":{"colorMode":"value","graphMode":"area","justifyMode":"auto","orientation":"auto","reduceOptions":{"values":false,"calcs":["lastNotNull"],"fields":""},"textMode":"auto"},"pluginVersion":"9.5.0","targets":[{"datasource":{"type":"prometheus","uid":"${datasource}"},"expr":"ds_task_instance_count_total{state=\"fail\"}","refId":"A"}],"title":"任务失败总数","type":"stat"},{"datasource":{"type":"prometheus","uid":"${datasource}"},"fieldConfig":{"defaults":{"color":{"mode":"thresholds"},"mappings":[],"thresholds":{"mode":"absolute","steps":[{"color":"blue","value":null}]},"unit":"short"},"overrides":[]},"gridPos":{"h":4,"w":4,"x":8,"y":0},"id":3,"options":{"colorMode":"value","graphMode":"area","justifyMode":"auto","orientation":"auto","reduceOptions":{"values":false,"calcs":["lastNotNull"],"fields":""},"textMode":"auto"},"pluginVersion":"9.5.0","targets":[{"datasource":{"type":"prometheus","uid":"${datasource}"},"expr":"ds_workflow_instance_running","refId":"A"}],"title":"运行中工作流数","type":"stat"},{"datasource":{"type":"prometheus","uid":"${datasource}"},"fieldConfig":{"defaults":{"color":{"mode":"thresholds"},"mappings":[],"max":1,"min":0,"thresholds":{"mode":"absolute","steps":[{"color":"green","value":null},{"color":"yellow","value":0.7},{"color":"red","value":0.85}]},"unit":"percentunit"},"overrides":[]},"gridPos":{"h":4,"w":6,"x":12,"y":0},"id":4,"options":{"orientation":"auto","reduceOptions":{"values":false,"calcs":["lastNotNull"],"fields":""},"showThresholdLabels":false,"showThresholdMarkers":true},"pluginVersion":"9.5.0","targets":[{"datasource":{"type":"prometheus","uid":"${datasource}"},"expr":"ds_worker_memory_usage","refId":"A"}],"title":"Worker 内存使用率","type":"gauge"},{"datasource":{"type":"prometheus","uid":"${datasource}"},"fieldConfig":{"defaults":{"color":{"mode":"thresholds"},"mappings":[],"max":1,"min":0,"thresholds":{"mode":"absolute","steps":[{"color":"green","value":null},{"color":"yellow","value":0.7},{"color":"red","value":0.85}]},"unit":"percentunit"},"overrides":[]},"gridPos":{"h":4,"w":6,"x":18,"y":0},"id":5,"options":{"orientation":"auto","reduceOptions":{"values":false,"calcs":["lastNotNull"],"fields":""},"showThresholdLabels":false,"showThresholdMarkers":true},"pluginVersion":"9.5.0","targets":[{"datasource":{"type":"prometheus","uid":"${datasource}"},"expr":"ds_worker_cpu_usage","refId":"A"}],"title":"Worker CPU 使用率","type":"gauge"},{"datasource":{"type":"prometheus","uid":"${datasource}"},"fieldConfig":{"defaults":{"color":{"mode":"palette-classic"},"custom":{"axisCenteredZero":false,"axisColorMode":"text","axisLabel":"","axisPlacement":"auto","barAlignment":0,"drawStyle":"line","fillOpacity":10,"gradientMode":"none","hideFrom":{"tooltip":false,"viz":false,"legend":false},"lineInterpolation":"linear","lineWidth":1,"pointSize":5,"scaleDistribution":{"type":"linear"},"showPoints":"never","spanNulls":false,"stacking":{"group":"A","mode":"none"},"thresholdsStyle":{"mode":"off"}},"mappings":[],"thresholds":{"mode":"absolute","steps":[{"color":"green","value":null}]},"unit":"short"},"overrides":[{"matcher":{"id":"byName","options":"success"},"properties":[{"id":"color","value":{"fixedColor":"green","mode":"fixed"}}]},{"matcher":{"id":"byName","options":"fail"},"properties":[{"id":"color","value":{"fixedColor":"red","mode":"fixed"}}]}]},"gridPos":{"h":8,"w":12,"x":0,"y":4},"id":6,"options":{"legend":{"calcs":["last","max"],"displayMode":"table","placement":"bottom","showLegend":true},"tooltip":{"mode":"multi","sort":"none"}},"pluginVersion":"9.5.0","targets":[{"datasource":{"type":"prometheus","uid":"${datasource}"},"expr":"increase(ds_task_instance_count_total{state=\"success\"}[5m])","legendFormat":"success","refId":"A"},{"datasource":{"type":"prometheus","uid":"${datasource}"},"expr":"increase(ds_task_instance_count_total{state=\"fail\"}[5m])","legendFormat":"fail","refId":"B"},{"datasource":{"type":"prometheus","uid":"${datasource}"},"expr":"increase(ds_task_instance_count_total{state=\"timeout\"}[5m])","legendFormat":"timeout","refId":"C"}],"title":"任务执行趋势(5分钟增量)","type":"timeseries"},{"datasource":{"type":"prometheus","uid":"${datasource}"},"fieldConfig":{"defaults":{"color":{"mode":"palette-classic"},"custom":{"hideFrom":{"tooltip":false,"viz":false,"legend":false}},"mappings":[],"unit":"short"},"overrides":[]},"gridPos":{"h":8,"w":6,"x":12,"y":4},"id":7,"options":{"legend":{"displayMode":"table","placement":"right","showLegend":true,"values":["value","percent"]},"pieType":"pie","tooltip":{"mode":"single","sort":"none"}},"pluginVersion":"9.5.0","targets":[{"datasource":{"type":"prometheus","uid":"${datasource}"},"expr":"ds_task_instance_count_total","legendFormat":"{{state}}","refId":"A"}],"title":"任务状态分布","type":"piechart"},{"datasource":{"type":"prometheus","uid":"${datasource}"},"fieldConfig":{"defaults":{"color":{"mode":"thresholds"},"mappings":[],"max":1,"min":0,"thresholds":{"mode":"absolute","steps":[{"color":"green","value":null},{"color":"yellow","value":0.05},{"color":"red","value":0.1}]},"unit":"percentunit"},"overrides":[]},"gridPos":{"h":8,"w":6,"x":18,"y":4},"id":8,"options":{"orientation":"auto","reduceOptions":{"values":false,"calcs":["lastNotNull"],"fields":""},"showThresholdLabels":false,"showThresholdMarkers":true},"pluginVersion":"9.5.0","targets":[{"datasource":{"type":"prometheus","uid":"${datasource}"},"expr":"rate(ds_task_instance_count_total{state=\"fail\"}[10m]) / (rate(ds_task_instance_count_total{state=\"finish\"}[10m]) + 0.001)","refId":"A"}],"title":"任务失败率(10分钟)","type":"gauge"},{"datasource":{"type":"prometheus","uid":"${datasource}"},"fieldConfig":{"defaults":{"color":{"mode":"thresholds"},"mappings":[],"thresholds":{"mode":"absolute","steps":[{"color":"blue","value":null}]},"unit":"short"},"overrides":[]},"gridPos":{"h":8,"w":12,"x":0,"y":12},"id":9,"options":{"displayMode":"gradient","minVizHeight":10,"minVizWidth":0,"orientation":"horizontal","reduceOptions":{"values":false,"calcs":["lastNotNull"],"fields":""},"showUnfilled":true},"pluginVersion":"9.5.0","targets":[{"datasource":{"type":"prometheus","uid":"${datasource}"},"expr":"ds_task_execution_count_by_type_total > 0","legendFormat":"{{task_type}}","refId":"A"}],"title":"任务类型分布","type":"bargauge"},{"datasource":{"type":"prometheus","uid":"${datasource}"},"fieldConfig":{"defaults":{"color":{"mode":"palette-classic"},"custom":{"axisCenteredZero":false,"axisColorMode":"text","axisLabel":"","axisPlacement":"auto","barAlignment":0,"drawStyle":"line","fillOpacity":10,"gradientMode":"none","hideFrom":{"tooltip":false,"viz":false,"legend":false},"lineInterpolation":"linear","lineWidth":1,"pointSize":5,"scaleDistribution":{"type":"linear"},"showPoints":"never","spanNulls":false,"stacking":{"group":"A","mode":"none"},"thresholdsStyle":{"mode":"off"}},"mappings":[],"thresholds":{"mode":"absolute","steps":[{"color":"green","value":null}]},"unit":"short"},"overrides":[]},"gridPos":{"h":8,"w":12,"x":12,"y":12},"id":10,"options":{"legend":{"calcs":["last"],"displayMode":"table","placement":"bottom","showLegend":true},"tooltip":{"mode":"multi","sort":"none"}},"pluginVersion":"9.5.0","targets":[{"datasource":{"type":"prometheus","uid":"${datasource}"},"expr":"ds_workflow_instance_running","legendFormat":"运行中","refId":"A"},{"datasource":{"type":"prometheus","uid":"${datasource}"},"expr":"increase(ds_workflow_instance_count_total{state=\"success\"}[5m])","legendFormat":"成功-{{process_definition_code}}","refId":"B"}],"title":"工作流实例趋势","type":"timeseries"},{"datasource":{"type":"prometheus","uid":"${datasource}"},"fieldConfig":{"defaults":{"color":{"mode":"palette-classic"},"custom":{"axisCenteredZero":false,"axisColorMode":"text","axisLabel":"","axisPlacement":"auto","barAlignment":0,"drawStyle":"line","fillOpacity":10,"gradientMode":"none","hideFrom":{"tooltip":false,"viz":false,"legend":false},"lineInterpolation":"linear","lineWidth":1,"pointSize":5,"scaleDistribution":{"type":"linear"},"showPoints":"never","spanNulls":false,"stacking":{"group":"A","mode":"none"},"thresholdsStyle":{"mode":"off"}},"mappings":[],"thresholds":{"mode":"absolute","steps":[{"color":"green","value":null}]},"unit":"short"},"overrides":[{"matcher":{"id":"byName","options":"内存使用率"},"properties":[{"id":"unit","value":"percentunit"},{"id":"custom.axisPlacement","value":"right"}]},{"matcher":{"id":"byName","options":"CPU使用率"},"properties":[{"id":"unit","value":"percentunit"},{"id":"custom.axisPlacement","value":"right"}]}]},"gridPos":{"h":8,"w":12,"x":0,"y":20},"id":11,"options":{"legend":{"calcs":["last","max"],"displayMode":"table","placement":"bottom","showLegend":true},"tooltip":{"mode":"multi","sort":"none"}},"pluginVersion":"9.5.0","targets":[{"datasource":{"type":"prometheus","uid":"${datasource}"},"expr":"ds_worker_active_execute_thread","legendFormat":"活跃线程数","refId":"A"},{"datasource":{"type":"prometheus","uid":"${datasource}"},"expr":"ds_worker_memory_usage","legendFormat":"内存使用率","refId":"B"},{"datasource":{"type":"prometheus","uid":"${datasource}"},"expr":"ds_worker_cpu_usage","legendFormat":"CPU使用率","refId":"C"}],"title":"Worker 资源监控","type":"timeseries"},{"datasource":{"type":"prometheus","uid":"${datasource}"},"fieldConfig":{"defaults":{"color":{"mode":"palette-classic"},"custom":{"axisCenteredZero":false,"axisColorMode":"text","axisLabel":"","axisPlacement":"auto","barAlignment":0,"drawStyle":"line","fillOpacity":10,"gradientMode":"none","hideFrom":{"tooltip":false,"viz":false,"legend":false},"lineInterpolation":"linear","lineWidth":1,"pointSize":5,"scaleDistribution":{"type":"linear"},"showPoints":"never","spanNulls":false,"stacking":{"group":"A","mode":"none"},"thresholdsStyle":{"mode":"off"}},"mappings":[],"thresholds":{"mode":"absolute","steps":[{"color":"green","value":null}]},"unit":"short"},"overrides":[{"matcher":{"id":"byName","options":"失败"},"properties":[{"id":"color","value":{"fixedColor":"red","mode":"fixed"}}]}]},"gridPos":{"h":8,"w":12,"x":12,"y":20},"id":12,"options":{"legend":{"calcs":["last","max"],"displayMode":"table","placement":"bottom","showLegend":true},"tooltip":{"mode":"multi","sort":"none"}},"pluginVersion":"9.5.0","targets":[{"datasource":{"type":"prometheus","uid":"${datasource}"},"expr":"increase(ds_alert_send_count_total{status=\"success\"}[5m])","legendFormat":"成功","refId":"A"},{"datasource":{"type":"prometheus","uid":"${datasource}"},"expr":"increase(ds_alert_send_count_total{status=\"fail\"}[5m])","legendFormat":"失败","refId":"B"}],"title":"告警发送趋势(5分钟增量)","type":"timeseries"},{"datasource":{"type":"prometheus","uid":"${datasource}"},"fieldConfig":{"defaults":{"color":{"mode":"palette-classic"},"custom":{"axisCenteredZero":false,"axisColorMode":"text","axisLabel":"","axisPlacement":"auto","barAlignment":0,"drawStyle":"line","fillOpacity":10,"gradientMode":"none","hideFrom":{"tooltip":false,"viz":false,"legend":false},"lineInterpolation":"linear","lineWidth":1,"pointSize":5,"scaleDistribution":{"type":"linear"},"showPoints":"never","spanNulls":false,"stacking":{"group":"A","mode":"none"},"thresholdsStyle":{"mode":"off"}},"mappings":[],"thresholds":{"mode":"absolute","steps":[{"color":"green","value":null}]},"unit":"s"},"overrides":[]},"gridPos":{"h":8,"w":12,"x":0,"y":28},"id":13,"options":{"legend":{"calcs":["mean","max"],"displayMode":"table","placement":"bottom","showLegend":true},"tooltip":{"mode":"multi","sort":"none"}},"pluginVersion":"9.5.0","targets":[{"datasource":{"type":"prometheus","uid":"${datasource}"},"expr":"rate(http_server_requests_seconds_sum{uri=~\"/projects.*\"}[5m]) / rate(http_server_requests_seconds_count{uri=~\"/projects.*\"}[5m])","legendFormat":"{{uri}} - {{method}}","refId":"A"}],"title":"API 平均响应时间","type":"timeseries"},{"datasource":{"type":"prometheus","uid":"${datasource}"},"fieldConfig":{"defaults":{"color":{"mode":"palette-classic"},"custom":{"axisCenteredZero":false,"axisColorMode":"text","axisLabel":"","axisPlacement":"auto","barAlignment":0,"drawStyle":"line","fillOpacity":10,"gradientMode":"none","hideFrom":{"tooltip":false,"viz":false,"legend":false},"lineInterpolation":"linear","lineWidth":1,"pointSize":5,"scaleDistribution":{"type":"linear"},"showPoints":"never","spanNulls":false,"stacking":{"group":"A","mode":"none"},"thresholdsStyle":{"mode":"off"}},"mappings":[],"thresholds":{"mode":"absolute","steps":[{"color":"green","value":null}]},"unit":"reqps"},"overrides":[]},"gridPos":{"h":8,"w":12,"x":12,"y":28},"id":14,"options":{"legend":{"calcs":["mean","max"],"displayMode":"table","placement":"bottom","showLegend":true},"tooltip":{"mode":"multi","sort":"none"}},"pluginVersion":"9.5.0","targets":[{"datasource":{"type":"prometheus","uid":"${datasource}"},"expr":"rate(http_server_requests_seconds_count{uri=~\"/projects.*\"}[5m])","legendFormat":"{{uri}} - {{method}}","refId":"A"}],"title":"API 请求速率","type":"timeseries"}],"refresh":"30s","schemaVersion":38,"style":"dark","tags":["dolphinscheduler","大数据"],"templating":{"list":[{"current":{"selected":false,"text":"Prometheus","value":"Prometheus"},"hide":0,"includeAll":false,"label":"数据源","multi":false,"name":"datasource","options":[],"query":"prometheus","refresh":1,"regex":"","skipUrlSync":false,"type":"datasource"}]},"time":{"from":"now-6h","to":"now"},"timepicker":{"refresh_intervals":["10s","30s","1m","5m","15m","30m","1h","2h","1d"]},"timezone":"browser","title":"DolphinScheduler 监控面板","uid":"dolphinscheduler-overview","version":1,"weekStart":""}导入完成后,你将得到一个包含以下面板的完整监控看板:
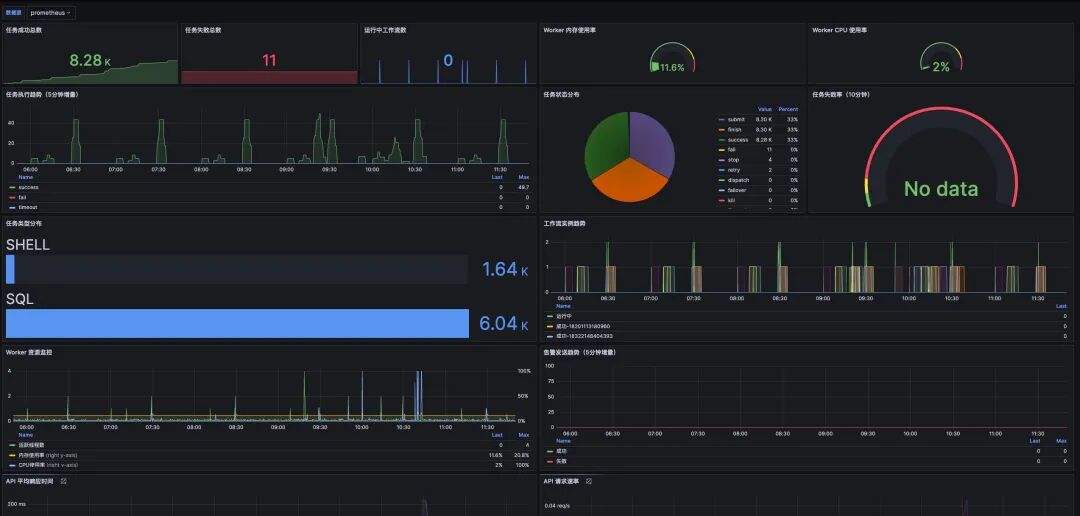
最终效果如下图:
四、总结
回顾一下,本文做了三件事:
如果你也在用 DolphinScheduler,强烈建议把这套监控搭起来。毕竟,凌晨三点被告警叫醒,总比第二天早上被老板叫醒要好。
如果这篇文章帮你避免了一次"调度挂了没人知道"的事故,不妨点个赞或收藏,下次需要的时候方便找到。有问题欢迎评论区交流,我们一起把大数据的坑踩平。
原文链接:https://blog.csdn.net/fengquan8866/article/details/157943614
END

用户案例
迁移实战
最新发版消息
加入社区
关注社区的方式有很多:
同样地,参与Apache DolphinScheduler 有非常多的参与贡献的方式,主要分为代码方式和非代码方式两种。
非代码方式包括:
完善文档、翻译文档;翻译技术性、实践性文章;投稿实践性、原理性文章;成为布道师;社区管理、答疑;会议分享;测试反馈;用户反馈等。
代码方式包括:
查找Bug;编写修复代码;开发新功能;提交代码贡献;参与代码审查等。

你的好友小海豚拍了拍你
并请你帮她点一下“分享”